15 August 2008

HSI CAD GBP


A Stronger Dollar
GBP is heading towards 177, the chart does not have day high/lows ie why you see a different picture. Even with this line chart, 182 is the minimum.
CAD chart is a few days old since I forwarded it to a friend for his reference to short CAD. It has an inverted multi bottom and looks set to clear resistance at 1.07, 1.10 and hit 1.14. Read chart above.

Hang Seng Index
Most readers are familiar with multi tops esp with HSI, read post on HSI early 2008 in this blog.

HSI is now extremely ugly and
the chart indicates it will hit 10000 after falling through neckline 21000.

A lot of investment banks are already offering private bank clients derivatives [similar to accumulators] to hedge their own positions [or that of their biggest clients] against its fall although it hasnt broken out of the multi top formed. I suspect there will be a lot of struggling before breaking out to the south. Two reasons - first, the really big/prestigious clients have to hedge their bets with the investment banks and this takes time, second, retail investors think it is cheap now so they will buy on big one day declines limiting the fallout for a while.

This is the first time I question the chart's predictive power as 10000
hasnt been seen for a long while, would it really hit 10000? Other indicators do not point to such lows:
  • 50% of 32000 is 16000, 30% [falling 70% from top] of 32000 is 9600 [close to 10000], but
  • 17000 and 14000 are strong supports.
  • the present rally started from 9000 and rose to 32000, retracing 50% means it will hit 20500, 68% means 17050;
  • The 10 yr chart tells a different story, it indicates the rising trend is intact, whether the fallout will hit the trend line or stay well clear [above] of it is still to be observed.
  • The year before 1995, it also formed a multi top and there is no breakout below the neckline by much and started rising again,
so beware.

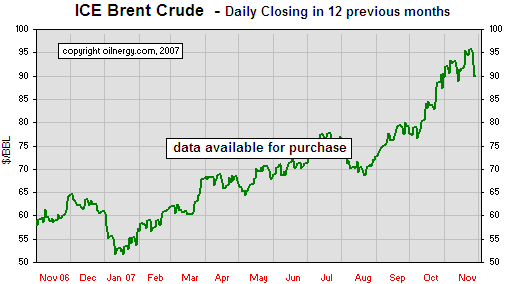
The few possibilities that 10000 will be hit are - there is a war close to China/HK, a bird flu pandemic or oil price hitting 200 above.

The time frame from the 1 yr chart says it will hit bottom in about 6 months or less after breakout. Even if it does hit 10000, it will be a long and winding road [not likely to be 6 months], there will be many false rallies before that.

23 March 2008

Update - Crude Oil, Gold, Currencies


my earlier update on 21 Feb already forecasted the severe drop in gold is coming. the gold price now is even lower than that of 21 feb [about 927], the price rise has all gone and evaporated. as indicated earlier once gold fell, aud will get hit too. aud got a new high but cant really sustain it and it also fell from the high [around 95.5] above 94 to only around 90.

crude has also dropped about 10%, if it does drop even more, the pressure on gold price will be intense.

now also look at shanghai comp index sci, it does point to a possible breakout above 3800 and reach a short term max of at least 4080.

if stocks rose, crude falls, currencies fall [against usd] too, then gold the invesment alternative will fall even faster.

gbp, as indicated earlier in this blog is the weakest, although the short squeeze sent it to 2.10 but fell back to 198, the fall [abt 6%] is even more drastic than that of aud [abt 4%]. euro is the exception as it looks more likely that some governments are behind the purchase which is why it falls much less.

expect this trend of weak gbp, aud and a rather strong euro to continue if and only if the stocks rally does materialize as the sci chart indicates.

21 February 2008

UPDATE - GOLD, PLATINUM


my earlier hunch that USD may not fall further turns out to be partly correct at least for now, it may still be true overall, read on.

GBP and Euro are getting no where but AUD rebounded strongly [still it hasnt hit new high]. iron ore prices rose 65% this year on agreement between mining companies and major steel producers which lead to the runup of AUD.

you can now look at the charts above for the outlook of gold and platinum. the shangahi composite index SCI chart serves as guidance on how fast the runup in gold prices will lead to at least a short term peak. the fall will also be drastic.

the sci is about 1000 mid 2005 and hit 2000 nov 2006 [about 17 mths], then it hit 4000 mar07 [just 4 months, incredible breakout], then another 6 months it almost hit 6000. what are all these telling us, shanghai stock market [a closed one] is not as mature as the gold market, so it went crazy once it broke out.

now look at platinum, in about one year it rose from 1200 to 2100 almost 900 and percentage wise 75%. there are shortages, but also speculation, the final 600 rise in only 2 months. this is short squeezing no matter what fundamentals.

gold is also in a similar shape, it is worst. if it once hit 1000 above, it will correct sharply. the contrast with platinum is it is pure financial play since industrial use is not a great demand. the all time low 335 for platinum and 252 for gold happened roughly about the same time. the ratio at that time is 1.32 much less than the current 2 - reasons: platinum has a lot of industrial uses and demand supply is much tighter.

both gold and platinum charts point to excessive speculation and will hit a wall soon, it will then correct sharply which will hit AUD.


12 February 2008

UPDATE

A lot of readers ask questions like when will this or that happen. The truth is I dont know. I only interpret the happenings from the chart given the circumstances. Most of the time they are correct and they happened within the time frame I mentioned. However, there are always exceptions like acts of god - a good case in point is the lengthy snow storm in China. It may disrupt certain chart patterns or delay or accelerate the forecasted happenings.

It is important to be patient in order to bear out the truth especially when you are waiting for a pattern formation. Sometimes a multi top chart takes longer than expected to form and break out. Go back in this blog and check out the chart related to HSBC - it first formed a head/shoulder chart with target to hit 132, but it went back straight up and almost retried the old high then formed another multi top chart with target 110. Both targets got hit but each has a very different outlook right after it was hit.

The reasons that I wrote in detail is to tell layman investors to be patient and when you sense something, wait for a pattern to be formed or about to be formed and take the necessary actions instead of trying to be god to foretell all events coming which is impossible.

Now comes the big part.

There are some strange observations recently, thus I sense something is coming along, but not on very solid grounds so you have to watch carefully the charts to be able to tell whether my hunch is correct.

Observations:

  • AUD old high is about 94 to USD, given the USD rate cuts and AUD rate increase, why hasnt it reached new high?
  • GBP fell a lot from it's recent high of 199 not to mention that the old high above 2 is very far fetch;
  • EUR has maintained their rates still it didnt reach it's old high after fed rate cuts;
  • Crude never even retry 95 or above after hitting 100, it rallies on news that weather will get cold in North Amercia shortly;
  • GOLD is actually falling [hit 918 fell back to 860] before the rate cuts but reached new high of 933 only to fall back to 890, but it managed to ride high again after crude oil resume a rally up towards 92.
What are all these telling us, my hunch "pure hunch" is that the USD money supply is contracting and fast, so every time some +ve news such as rate cuts and fiscal spending like tax rebates are announced, the currencies above or gold or crude oil reacted on the news but cant reach their old highs.

Therefore my predictions are that, oil rally will falter hitting gold along the way and also currencies will fall against the USD before it can rally back up if it will. GBP is the weakest, EUR will rally back up after hitting 130-135 so will AUD.

The charts will take a little bit longer to confirm the above if they ever will.

22 January 2008

UPDATE - Hang Seng


for readers who are familiar with this blog, you should have benefited from staying clear of HSBC. read earlier release for HSBC forecasts.

here comes Hang Seng albeit a bit late since the fallout is faster than predicted. Look at the 6 mth chart, this is clearly a multi top chart with neckline at 26000, the minimum magnitude going south would be 20000 [26000-6000], so brace yourself for a rough ride.

the tricky part is the 2 yr chart, if it does reach 20000, bounces up and falls back again breaching the 20000 mark, then a head and shoulder occurs and the chart looks very ugly.
how will recessions wound up hs index:
  1. a recession only causes upset of 25-35% from top,
  2. a severe one - 40-50%,
  3. a major downturn can chop 70-80% off the top [e.g. taiwan, japan and earlier downturn of china stock markets]
it would be extremely hard to tell 2nd from 3rd, so bear this in mind when you make your investments around the 20000 mark.

05 January 2008

UPDATE - DJ, Subprime

the dow is looking to form a multi top with neckline at 12800, if it falls through it will hit 10800 - a fall of further 16% from this level and that is the minimum. expect a flurry of fiscal spending [sort of direct money printing] announcements and interest rate cuts.

if you look at the volume, it is increasing after the yearend [avoid clashing with yearend window dressing] while index is falling, so the probability of it falling below 12800 is quite high.

both citigroup and merrill have new ceos, they will book the largest provisions possible [ie their capital base can bear] this fourth quarter to avoid further significant losses after they are in town for two or three quarters. such loss announcement might be coupled with further new investors to these two banks as their capital bases may have shrunk further and cannot bear such heavy losses. this will put pressure on hsbc to announce heavy provisions. read my earlier updates and forecast on its price.

if investments made by new investors to citigroup, ML, UBS are locked in with the spot price at the time of announcements, they would have incurred losses now and further going forward. if the investments are convertible bonds or preference shares with convertible options then they are better off.

the subprime mess will take at least 6 years [for the housing market] to reach a bottom. counting from 2006 after its peak, it takes minimum 2012 to get out of the mess. the japs took more than 16 years [1989-2005] to get out of a hole they digged themselves in.

10 December 2007

UPDATE - UBS


only just one week ago, you read subprime is going to get worse and fast. now look at ubs who just announced how bad it is hit by subprime.

also look carefully at this chart. the first double top neckline is at 55, it fell through and reached the 45 mark as predicted by this kind of chart type. however, look further, you will find it just didnt end there, it now has a multi-top chart and neckline at 50, this is getting worrisome. it did fall through the 50 line, the magnitude south is min 35 ie a fall of 30% more from here.

if you look at banks on their reporting, they didnt come honest with their exposures to SP. therefore i am almost 100% sure that
  • HSBC will reach 110 target within the time frame i mentioned in the earlier update about it.
  • the interest rate drop by fed will reach at least 1.5% by end08.
  • oil will indeed fall back close to 80.

02 December 2007

SUBPRIME, OIL PRICE and DJ


Many of us are confused about how the subprime woes will play out and also the direction of DJ, interest rates and oil price.

Simple - subprime woes will only get worse and fast, why?
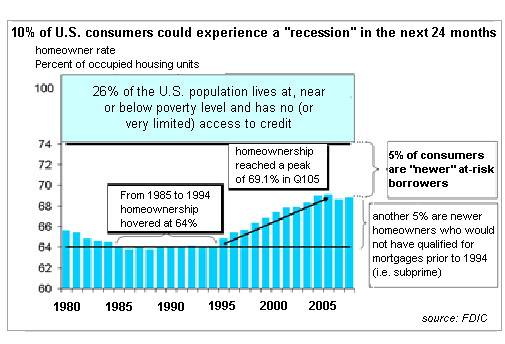
  1. A broad base housing market decline rarely ends in 2-3 years, so dont believe that subprime woes can end mid08 though it peaked in early 05. It will take minimum 6 years to recover if not more. The Japanese one lasted 16 years with false alarms of bottoming out all the way.
  2. Foreclosures are going up
  3. Layoffs are on the way - Citigp announced to layoff 50,000 already. 3-5 months after being laid off, if people still cant find employment, they cant finance their mortgages thus further pressuring banks to foreclose which will make the housing market even weaker
  4. Banks will layoff before xmas to cut overhead
  5. Finance sector on cutting costs will delay all capital outlays including IT this is why Nasdaq index gets hit even harder
  6. Delinquent loans whether they be mortgage or credit card related are already going up fast
  7. Once consumers stop spending the contraction will accelerate
  8. Two charts base on FDIC data indicate how serious the problem is. The magnitude this time is more serious than any of the past corrections of the housing market for the past 30 years or even since 1933.
  9. DJ Transportation is known to reflect the economy ahead better than DJIA, its performance can be seen deterioratiing faster than DJIA from July07, not until you see a turnaround in DJT ahead of DJIA, the general direction is south.
Check out this link and read carefully the full extent of the problem:
http://news.bbc.co.uk/2/hi/business/7073131.stm
The city of Cleveland [Ohio] alone is hard hitted, you can imagine how bad it can be with the rest of the US counted in.

Expect 1 - 1.5% or even 2% cut in interest rates by end08 starting from the next Fed meeting in mid Dec.

It is already in the press that help is on the way from govt, banks, FIs to avoid further upsets when interest rates reset for variable rate mortgages as they fall due shortly. Many FIs will use the news to squeeze short stock positions for a while and also to boost performance for qtr/year end investment positions.

DJ would not have been this high if not for the oil stocks fast and substantial rise, but lately when oil is hitting new high, oil stocks such as Exxon lanquish below their highs reached earlier, this indicates oil has reached a short term peak already. Read my update released 06Jul19 which forecasted the outcome of a similar situation. The crude correction lasted 6 months, how long it will last this time round is anybody's guess, but the faster it corrects, the sharper the rally.

So, couple with subprime woes, expect DJ to fall further subsequent to a rebound after the help on interest rates reset is announced, in short after yearend.

24 November 2007

UPDATE - HSBC


look carefully at this chart, this is a classic multiple top with neckline around 132, reached 152 top in nov06 dropped to 132 in apr07, hit it again in aug07 retried 154 top but didnt manage to stay there for long.

if you try to track the sequence of events that hsbc came out to announce the bad news back in mar07, messages
had already circulated on the web that hsbc was a strong sell as early as 25feb07 when its price was still at 140 and even further back in 4jan07. check here for more details :
http://messages.finance.yahoo.com/Business_%26_Finance/
Investments/Stocks_%28A_to_Z%29/Stocks_H/
threadview?bn=8317&tid=5901&mid=5905
http://messages.finance.yahoo.com/Business_%26_Finance/
Investments/Stocks_%28A_to_Z%29/Stocks_H/
threadview?bn=8317&tid=5629&mid=5639

you will have to cut and paste to connect the three lines to get the url since the blog site truncate the url if it is too long.

mr greenspan said he was not aware of the size of the subprime problem until very late, but everyone knew greenspan is a figures maniac ie he read a lot of statistics and the mortgage bankers association publish semi annual reports and had in their reports disclose that interest only and payment options home loan were growing like hell, so he just excused himself for his oversight. read greenspan evils in my earlier updates.
read also 11dec06 article titled
Exotic, Non-Traditional, or Risky at following url: http://www.creditslips.org/creditslips/
mortgage_debt_home_equity/index.html

now it is entering a crucial phase, if it drops below 132 say hitting 126, then we will see a new low at 110 - unimaginable for hsbc fans, but probable. check my earlier forecast on hsbc. it may still bump around this area for a while before retreating below this level, the number of months it was above 132 is 16, so it would take roughly 5-8 months to reach this low if it ever would.

so watch closely this level - 132, and take particular attention to the months apr - jul in 2008.

08 September 2007

UPDATE


CitiGroup and Dow Jones
look at citigroup's chart, a very clear double top is formed neckline at 48, broken downward, already retraced the neckline and starts falling again, it will reach no less than 41. dow also happened to be forming a high low top neckline at 12800, failing which a 1200 points [14000-12800] fall is in the cards.
a lot of people always ask about timing, take the time it took to form the double top and the fall usually takes about 1/2 to 1/3 of that time or shorter to reach the target. take citi as an example, it should take between 2.5-4 months to get there.
read my earlier update on hsbc, it happened all within one day to reach 132.

Hang Seng
hang seng is more tricky as the chart offers no conclusive evidence of double top, but look carefully at the volume, it falls steadily with the steep rise in the index from slightly below 20000 all the way up to 24000 with the formation of a rising wedge, this indicates it will fall back to below 20000 pretty fast. another indication that it has reached a top is because government usually buys at the top, with the hk govt increasing its stake in the hk stock exchange, it must have reached a top, at least for the short term.