Abe, the new prime minister coming in announces an inflation target for the central bank, would that work?
BOJ people must be careful, once their own people get angry as bond yields fall short of inflation by a wide margin, this may trigger selling of bonds on a wholesale scale which would pull up interest rates long and short term, giving corporates much harder to maneuver their long term debt position or simply running into financial losses because of higher interest rates. Corporations large medium or small might not be able to survive on higher interest rates and tighter credit conditions, the failing of which will lead to even higher unemployment - in other words recession again.
29 December 2012
2013 Dow vs HSI, CRE, Crying wolf Crying foul
Crying wolf, Crying Foul
In hong kong, we heard from our HKMA head mr yam or mr chan in
2008/2009 that we should think twice before buying an apt, now we still hear
the same from mr chan. Both had been crying wolf for so many years that layman does not
know whether they should continue to abide by their advice.
Those who did not heed his warnings already reaped major
benefits from big ben’s QE and would not mind hearing some noise from him. But those
who heed his warnings are crying foul since without some physical assets in
hand, your cash is losing their value while your living costs have gone skyrocketed
plus the cash in the bank has no yield which is the major headache for many
people.
This is why you should never heed officials’ advice without
giving some serious thoughts behind it since officials are like stock brokers -
it is always time to buy stocks while for officials it is always time to be
cautious, at their angle only.
Commercial Real Estate
Here in hk, we might be coming to a wall for CRE although
the BSD and SSD in the residential market is driving investors to invest in CRE
and car parks, but recent vacancy in CRE which could be spotted in busy
districts like CWB, TST and MK and drop in demand from mainland tourists is a
forewarning that difficult times are ahead for CRE owners or landlords. A recent
visit to a realty broker for only half an hour, there are already two landlords
one residential who wants to sell his apt [even under SSD period] and one
commercial who wants to sell two units. In such a short period of time, you can
say it is coincidence that two are coming in to sell their properties or the market has turned
the corner if not for a long while at least for the short term. In a
slow market, if certain landlords have cash flow problems and would want to
sell into the market with limited buyers, only below market prices will
complete a deal. Such landmark prices can set a precedent for the market to
follow and will only drive more buyers away which could set the market up for
even lower prices.
However it is not all gloom and doom, my hunch is this is a
short reprieve for the real estate market to relieve some pressure which is not
bad. This is more like a 1994 set back which is a prelude to the final rally of
1997.
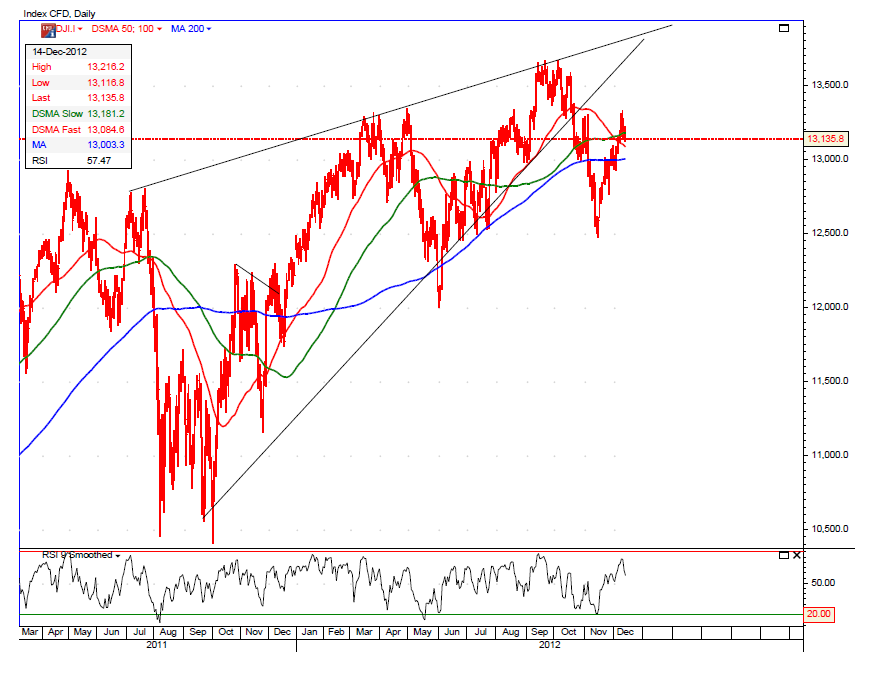
2013 Dow vs HSI
In the past, dow has outperformed hsi, would that change in
2013 – likely, why?
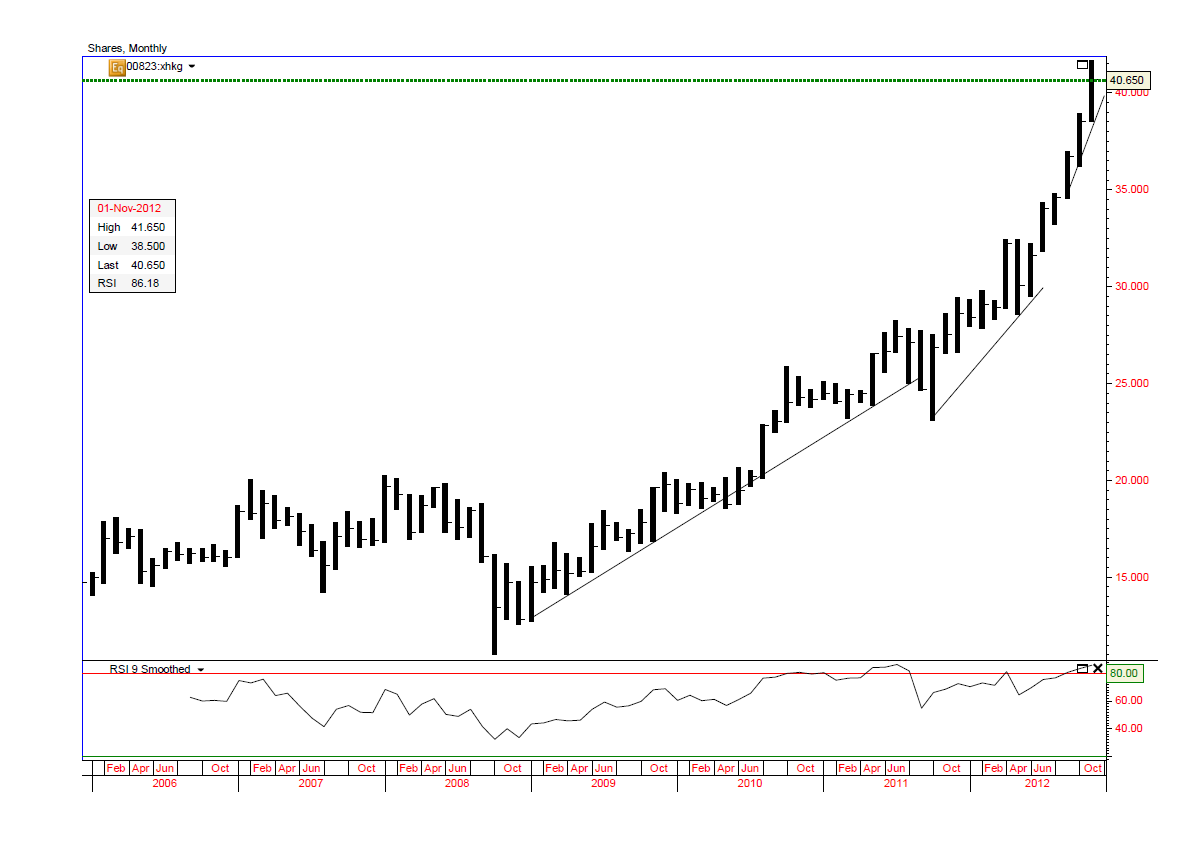
Dow’s chart has a rising wedge formation which points to a
serious correction while hsi chart has a round bottom extending for maybe a
year or more which is more solid.
27 December 2012
Bernie Madoff Letter to CNBC
downloaded from CNBC
A number of you have been asking my views on a couple of subjects that I am comfortable in going on the record, because they are not related to my case. there for(sic) the following are remarks that you are free to use for whatever value you feel are appropriate.
The issue of electronic trading has recently been focusing on the lack of transparency of the markets with the emergence of DARK POOLS.
This has now spread to the recent acquisition of the NYSE . While I have always been an advocate of electronic trading due to the efficiency the lower costs they bring o the markets, I am nit (sic) a fan of the lack of transparency the DARK POOLS create.
It is important to examine why there has been this growing interest in the use of dark pools. Markets have always focused on the speed with which information becomes available. Of course this information can be composed of various types.
It could be corporate developments like earnings or mergers or it can be information regarding the placements of buy and sell orders and who is placing these orders. It is the latter information that has created the interest in the dark pools.
Institutions have always attempted to guard this buy and sell information from exposure to the market for fear of being FRONT RUN. Certainly they are entitled to have this right of confidentiality.
This being said, the more secret this information. The more valuable this information is to those that can obtain it. Therein lies the problem. It is naive to think that there will be no leakage of this information.
Although one would be lead to believe that with the recent spate of Insider trading prosecutions, that insider trading is a new development. This is false. It has been present in the market forever, but rarely been prosecuted. The same can be said for front running of orders.
The other area of discussion involves the growth of hedge funds, particularly feeder funds. In spite of the early held belief. of which I was of this opinion, that the extra layer of costs related to commissions and profit sharing that went along with feeder funds.
They have continued to grow. It has been this additional layer of costs that have created the need for more risk to be taken to earn worthwhile returns. This has created a minefield of regulatory problems involving the very reasons that the desire for a lack of transparency has grown.
Both of these areas are going to be the greatest challenge that both the industry and the regulators are going to face .
15 December 2012
DOW, APPLE, GOLD and the ECONOMY

click chart for a better view.
apple chart has a typical head n shoulder formation, it wont be long before it falls deeper, read this blog on earlier discussion of the final settlement pricing of apple. there could be some struggling usually at the neckline 520 which has now been broken. if apple stays below 500 for three weeks or more, not a good sign.
the dow is also not looking to reach new highs above 14000 given the formation of a rising wedge which can bring dow down much harder, the pullback has already occurred, thus it is not likely to go up much higher.
economy will go slower no matter fiscal cliff or not as it will cut into consumer spending one way or the other, this is why there is such a rush to QE to avoid economy contracting too fast once it is over the cliff or a deal is struck to limit expenses and raise taxes.
gold prices is telling the same story that even current QE cannot sustain prices above 1700. it usually is a precursor of the price of oil, it has done poorly for the past few months, my hunch is oil will fall further and gold may go down with it.
22 November 2012
Link Reit, Hysan, HK Real Estate

the link reit may be peaking out soon, the three phase of rising trend is exhausting the buying power.
now look at hysan, it looks like there is a rising wedge forming which could lead to a drastic fall if it does not break away from the rising wedge soon ie shooting up past 37.
both companies are similar in nature only that link still has more room for growth and improvement to its 30 years old portfolio.
my hunch is it will happen in less than 6 months.
another indication that real estate might be reaching a peak is that
- the new duties BSD and SSD will have a hard impact on residential transactions while channeling funds to commercial realty and car parks which recently has reached into stratosphere
- BSD will take away the support for the market when it falls and SSD prevents marginal buyers purchasing apartments although prices might then become more reasonable but their jobs are now at risk
- on QRW alone between Possession Street and Queen Street which is only might be a 100m long, there are more than 5 property agents on street level, also an indication that this will not be long before a set back is on the way or might be round the corner already.
17 November 2012
Apple and Dow, HSI


click on chart for a better view
not long back, we talked about apple, now it is apple again, why?
because it was predicted earlier that apple will soon top out, now it has fallen 20% from peak price, it is likely to hit bottom soon and will end the recent dow fallout.
the reverse [downward] rsi vs the price uptrend spells trouble for apple and the fallout is real fast, but rsi is now hitting low range and will soon rise or stay flat.
then where will it land?
looking at the chart, the year began with apple at 426 and rose almost 70%, so anyone who own apple will have their shares grown 70%+ if they have not sold their shares in the past year end.
if it is going to form a head shoulders pattern, it has reached the neckline, my hunch is between 30%-40% from top ie 420-490. last price is 527.
watch out for a rising rsi vs a price downtrend to confirm the uptrend breakout, just like the downtrend breakout.
as there is a lot of speculation that the capital gains tax will rise from the current 15% back up to previous level of 20% in 2013, but a more likely scenario is 28% which has been the case for a long time in history at this level. if you hold stocks like apple with plenty of profits in hand, you would like the profits be taxed at 15% not 28%, this is one reason why apple has fallen so hard and dow's 1000 pt fall. we have seen tons of big wig investors unloading, one from facebook's board selling more than half his angel investments, lucasfilm owner selling out to disney, a key investor sold all his hp shares.
some guys will buy back their shares if the stock is a good one and hard hit. hp is not among it though.
in hk, we will soon have picc going for ipo, the dates are 22 nov to commence ipo applications and 5 dec listing, this may soon spell the end of the hsi downtrend.
21 October 2012
HK Real Estate, GDP, Velocity of Money, M Base [Part 2]...


i have privately discussed these topics with various readers and they should have some familiarity with the blog [Part 1] right before this one.
the first chart here is chart 4 of Part 1, click on the charts for a better view.
HK Real Estate
if you look at chart 4 mentioned in Part 1 of the title, you will read then in 2008 the M base is only 800, now we have 2600 and that is 3 times as much. back in 2008, most apartments are in the range of hkd4500-5000 per sq ft, with a doubling of M base, you will surely have the real estate prices lifted towards a double or not far from it. this assumes a lot of money was channeled in that direction and it surely has since there are no yields to be found at the bank for deposits. but if you look further the M base expanded 3 times as much.
GDP
M base x Velocity of M = GDP, with so much debt and very strict lending standards, there is no way for the market to invest and also the euro crisis is putting a dent to investments, so the velocity of money trends lower thus the fed has to increase the money supply to make sure GDP is not slowing too much, yet a lot of the GDP generated is at the expense of the middle class which constrains spending and thus further investments as there is no revenue growth by volume but by price alone.
velocity of money is how many times the money base cycles through the economy, if people buy more stuff, thus more transactions and corps have more revenue and profits, so they can raise prices, increase salaries/wages and the cycle goes on. now we have the reverse due to deleveraging, people spends less on average, so corps cut back and limit wage increases though they can still maintain profits by cutting back faster than the drop in revenue and also reverse provisions.
HK Real Estate, GDP, Velocity of Money, M Base [Part 1]
the following is an article from a newsletter.
most of you might not be interested in the full article, then read the blog following this one which will give you some insights to the above topics with the subject.
Hoisington Investment Management
Quarterly Review and Outlook
Third Quarter 2012


most of you might not be interested in the full article, then read the blog following this one which will give you some insights to the above topics with the subject.
Hoisington Investment Management
Quarterly Review and Outlook
Third Quarter 2012
Growth Recession
Entering the final quarter of the year, domestic and global
economic conditions are extremely fragile. Across the globe, countries
are in outright recession, and in some instances where aggregate growth
is holding above the zero line, manufacturing sectors are contracting.
The only issue left to determine is the degree of the downturn
underway. International trade is declining, so weaknesses in different
parts of the world are reinforcing domestic deteriorations in economies
continents away. With this global slump at hand, a highly relevant
question is whether the U.S. can escape a severe recession in light of
the following:
a) the U.S. manufacturing sector that paced domestic economic
growth over the past three years has lapsed into recession;
b) real income and the personal saving rate have been slumping in the face of an interim upturn in inflation, and
c) aggregate over-indebtedness, which is the dominant negative
force in the economy, has continued to move upward in concert with
flagging economic activity.
New government initiatives have been announced, particularly by
central banks, in an attempt to counteract deteriorating economic
conditions. These latest programs in the U.S. and Europe are similar to
previous efforts. While prices for risk assets have improved,
governments have not been able to address underlying debt imbalances.
Thus, nothing suggests that these latest actions do anything to change
the extreme over-indebtedness of major global economies.
To avoid recession in the U.S., the Federal Reserve embarked on
open-ended quantitative easing (QE3). Importantly, the enactment of
QE3 is a tacit admission by the Fed that earlier efforts failed, but
this action will also fail to bring about stronger economic growth.
Commodity Market Reactions
Commodity markets have risen in reaction to the Federal
Reserve’s liquidity injections into the banking sector (Table 1). From
the time the press reported that the Fed was moving toward QE1 & QE2
commodity prices surged. During QE1 & QE2 wholesale gasoline
prices jumped 30% and 37%, respectively, and the Goldman Sachs Commodity
Food Index (GSCI-Food) rose 7% and 22%, respectively. From the time
the press reported that the Fed was moving toward QE3, both gasoline and
the GSCI Food index jumped by 19%, through the end of the 3rd quarter.
Two theoretical considerations account for the rise in
commodity prices during QE3. The first is the expectations effect.
When the Fed says they want higher inflation, the initial reaction of
the markets is to “go with”, rather than fight the Fed. The second
linkage, which is the expanded availability of funds used for collateral
(margin), was identified and subsequently confirmed by Newedge
economist, Dr. Rod McKnew, who stated, “In a world of advanced
derivatives, high cash balances are not required to take speculative
positions. All that is required is that margin requirements be
satisfied.” Thus, when the Fed massively expanded reserve balances in
QE1 and QE2, margin risk was minimized for those market participants who
wished to take positions consistent with the Fed’s goal of higher
inflation, and who had either direct or indirect access to the Fed’s
hugely inflated reserve balances. The Apr
il 22,
2011 issue of Grant’s Interest Rate Observer documented support for
McKnew’s insight. They asked Darrell Duffie, the Dean Witter
Distinguished Professor of Finance at the Graduate School of Business at
Stanford University, whether excess reserves could serve as collateral
for futures and derivatives transactions. Dr. Duffie’s answer was
“acceptable collateral is a matter of private contract, but reserve
deposits are virtually always acceptable.”
Devastation for Households
The unintended consequence of these Federal Reserve actions,
however, is to actually slow economic activity. The CPI rose
significantly in QE1 and QE2 (Chart 1). These price increases had a
devastating effect on worker's incomes (Chart 2). Wages did not
immediately respond to commodity price changes; therefore, there was an
approximate 3% decline in real average hourly earnings in both
instances. It is true that stock prices also rose along with commodity
prices (S&P plus 36% and 24%, respectively, in QE1 and QE2).
However, median households hold a small portion of equities, and thus
received minimal wealth benefit.
Wealth Effect
Despite the miserable economic results in QE1 and QE2, we now
have QE3. Fed Chair Ben Bernanke and other Fed advocates believe the
“wealth effect” of QE3 will bring life to the economy. The economics
profession has explored this issue in detail. Sydney Ludvigson and
Charles Steindel in How Important is the Stock Market Effect on Consumption
in the FRBNY Economic Policy Review, July 1999 write: “We find, as
expected, a positive connection between aggregate wealth changes and
aggregate spending. Spending growth in recent years has surely been
augmented by market gains, but the effect is found to be rather unstable
and hard to pin down. The contemporaneous response of consumption
growth to an unexpected change in wealth is uncertain, and the response
appears very short-lived.” More recently, David Backus, economic
professor at New York University found that the wealth effect is not
observable, at least
for
changes in home or equity wealth.
A 2011 study in Applied Economic Letters entitled, Financial Wealth Effect: Evidence from Threshold Estimation
by Sherif Khalifa, Ousmane Seck and Elwin Tobing found “a threshold
income level of almost $130,000, below which the financial wealth effect
is insignificant, and above which the effect is 0.004.” This means a $1
rise in wealth would, in time, boost consumption by less than one-half
penny.
These three studies show that the impact of wealth on spending
is miniscule—indeed, “nearly not observable.” How the Fed expects the
U.S. to gain any economic traction from higher stock prices when rising
commodity prices are curtailing real income and spending is puzzling.
This is particularly relevant when econometricians have estimated that
for every dollar of gained real income, consumption will rise by about
70 cents. Conversely, the Fed actions are causing real incomes to
decline, which has a 70-cent negative impact on spending for every
dollar loss. Compare that with the 0.004 positive impact on spending
for every one-dollar increase in wealth. Former Fed Chairman, Paul
Volcker, summarized the new Fed initiative as sufficiently and
succinctly as anyone when he stated that another round of QE3 “is
understandable, but it will fail to fix the problem.”
An International Corollary
The unintended consequences of QE3 could also serve to worsen
and undermine global economic conditions already under considerable
duress. When the Fed actions lead to higher food and fuel prices, the
shock wave reverberates around the world, with many foreign economies
being hit adversely. When prices of basic necessities rise, the
greatest burden is on those with the lowest incomes since more of their
budget is allocated to the basic necessities such as food and fuel.
Thus, a jump in daily essentials has a more profound negative impact on
living standards in economies with lower levels of real per capita
income.
Can the Fed Create Demand?
Can all the trillions of dollars of reserves being added to the
banking system move the economy forward enough to eventually create a
higher level of aggregate spending? Our analysis of the aggregate
demand curve and its determinants indicate they cannot. The question is
whether monetary actions can shift this aggregate demand (AD) curve out
to the right from AD0 to AD1 (Chart 3). If this were possible, then
indeed the economy would shift to a higher level of prices and real GDP.
The AD curve is equal to planned expenditures for nominal GDP
since every point on the curve is equal to the aggregate price level
(measured on the vertical axis of the graph), multiplied by real GDP
(measured on the horizontal axis of the graph). We know that GDP is
equal to money times its turnover or velocity, which is called the
equation of exchange as developed by Irving Fisher (Nominal GDP = M*V).
Deconstructing this formula, M (or M2) is comprised of the
monetary base (currency plus reserves) times the money multiplier (m).
The Federal Reserve has control over the monetary base since its balance
sheet is the dominant component of the monetary base. However, the Fed
does not directly control the money supply. The decisions of the
depository institutions and the non-bank public determine the money
multiplier (m). M2 thus equals the monetary base multiplied by the
money multiplier. The monetary base, also referred to as high powered
money, has exploded from $800 billion in 2008, to $2.6 trillion
currently, but the money multiplier has collapsed from 9.3 to 3.9 (Chart
4). Therefore, the money supply has risen significantly less than the
increase in the Fed’s balance sheet, with the result that neither rapid
gains in real GDP nor inflation were achieved. Indeed, with the
exception of transitory episodes, inflation re
mains
subdued and the gain in GDP in the three years of this expansion was the
worst of any recovery period since World War II.
The other element that is required for the Fed to shift the
aggregate demand curve outward is the velocity or turnover of money over
which they also have no control. During all of the Fed actions since
2008 the velocity of money has plummeted and now stands at a five decade
low (Chart 5).
The consequence of the Fed’s lack of control over the money
multiplier and velocity is apparent. The monetary base has surged 3.3
times in size since QE1. Nominal GDP, however, has grown only at an
annual rate of 3%. This suggests they have not been able to shift the
aggregate demand curve outward. Nor, with these constraints, will they
be any more successful in shifting that curve under the present
open-ended QE3. Increased aggregate demand and thus rising inflation is
not on the horizon.
[For a more complete discussion of the complexities of the
movement of the aggregate supply and aggregate demand curves please see
the APPENDIX.]
Treasury Bonds
As commodity prices rose initially in all the QE programs,
long-term Treasury bond yields also increased. However, those higher
yields eventually reversed and generally continued to ratchet downward,
reaching near record lows. The current Fed actions may be politically
necessary due to numerous demands for them to act to improve the clearly
depressed state of economic conditions. However, these policies will
prove to be unproductive. Economic fundamentals will not improve until
the extreme over-indebtedness of the U.S. economy is addressed, and this
is in the realm of fiscal, not monetary policy. It would be more
beneficial for the Fed to sit on the sidelines and try to put pressure
on the fiscal authorities to take badly needed actions rather than do
additional harm. Until the excessive debt issues are addressed, the
multi-year trend in inflation, and thus the long Treasury bond yields
will remain downward.
APPENDIX
One of the most important concepts in macroeconomics is
aggregate demand (AD) and aggregate supply (AS) analysis – a highly
attractive approach that is neither Keynesian, monetarist, Austrian, nor
any other individual school, but can be used to illustrate all of their
main propositions. However, before detailing the broader
macroeconomics associated with the movement of the AD and AS curves, it
is important to understand microeconomic supply and demand curves. This
can best be illustrated through the recent impact the Fed’s decisions
had on commodity prices. In the commodity market, like individual
markets in general, the demand curve is downward sloping, the supply
curve is upward sloping, and where they intersect determines the price
of the commodity and the quantity supplied/demanded. The micro-demand
curve slopes downward because as the price of an item rises, the
quantity demanded falls due to income and substitution effects (
buyers
can shift to a substitute product). The micro-supply curve slopes
upward since producers will sell more at higher prices than lower ones.
Both supply and demand schedules are influenced by expectation,
fundamental, and liquidity considerations. When the Fed says that they
want faster inflation and that they are going to take steps to achieve
this objective, both economic theory and historical experiences indicate
that commodity prices will rise, at least transitorily (as seen with
the surge in commodity prices after the announcement of QE1, QE2 and
QE3). Information and liquidity available to the buyers is also
available to the suppliers, so by saying faster inflation is ahead,
suppliers are encouraged to reduce or withhold current production or
inventories, moving the supply curve inward. Thus, in the commodity
market, the Fed action spurs an outward shift in the micro-demand curve
along with an inward shift of the micro-supply curve, producing higher
prices and lower quantities. These microeconomic developments transmit
to the broader economy, which we will now trace through A
D and
AS curves.
The AD curve slopes downward and indicates the amount of real
GDP that would be purchased at each aggregate price level (Chart 6).
Aggregate demand varies inversely with the price level, so if the price
level moves upward from P0 to P1, real GDP declines from Y0 to Y1. When
the price level rises, real wages, real money balances and net exports
worsen, thereby reducing real GDP. The rationale for the downward
sloping AD curve is thus quite different from the sloping of the
micro-demand curve since substitution effects are not possible when
dealing with aggregate prices. In order to improve real GDP with a
rising price level, the AD curve would need to be shifted outward and to
the right (from AD0 to AD1). And as detailed in the letter, the Fed is
not capable of shifting the entire AD curve.
The AS curve slopes upward and indicates the quantity of GDP
supplied at various price levels. The positive correlation between
price and output in micro and macroeconomics is the same since the AS
curve is the sum of all supply curves across all individual markets.
When Fed policy announcements shock commodity markets, the AS curve
shifts inward and to the left (from AS0 to AS1). This immediately
causes a reduction in real GDP (the difference between Y0 and Y1) as the
price increases by the difference between P0 and P1 (also Chart 6).
Furthermore, as discussed in the letter, lower GDP as a result of higher
prices reduces the demand for labor and widens the output gap, setting
in motion a negative spiral.
For Fed policy to improve real GDP, actions must be taken that
either (1) shift the entire demand curve outward (to the right), or (2)
do not cause an inward shift of the AS curve that induces an adverse
movement along the AD curve. Accordingly, the Fed is without options to
improve the pace of economic activity.
20 October 2012
7 traits to avoid
A good article from Financial Post.

Investors are ‘normal,’ not rational,”
says Meir Statman, one of the leading thinkers in behavioral finance.
Behavioral finance aims to better
understand why people make the financial decisions they do. And it’s a
booming field of study. Top behavioral finance gurus include Yale’s Robert Shiller
and GMO’s James
Montier.
It’s also a crucial part of the Chartered
Financial Analyst (CFA) curriculum, a course of study for financial
advisors and Wall Street’s research analysts.
We compiled a list of the seven most
common behavioral biases. Read through them, and you’ll quickly realize
why you make such terrible financial decisions
Your
brain thinks it’s great at investing
Overconfidence may be the most obvious behavioral
finance concept. This is when you place too much confidence in your
ability to predict the outcomes of your investment decisions.
Overconfident investors are often
underdiversified and thus more susceptible to volatility.
Source: CFA Institute
Your
brain doesn’t know how to handle new information.
Daniel Goodman / Business Insider.com
Anchoring is related to overconfidence. For
example, you make your initial investment decision based on the information
available to you at the time. Later, you get news that materially affects
any forecasts you initially made. But rather than conduct new analysis,
you just revise your old analysis.
Because you are anchored, your revised
analysis won’t fully reflect the new information.
Source: CFA Institute
Your
brain is too focused on the past.
Lewis & Clark & Sacagawea
A company might announce a string of
great quarterly earnings. As a result, you assume the next earnings
announcement will probably be great too. This error falls under a broad
behavioral finance concept called representativeness: you incorrectly
think one thing means something else.
Another example of representativeness is
assuming a good company is a good stock.
Source: CFA Institute
Your
brain doesn’t like to lose.
Bob Owen via Flickr
Loss aversion, or the reluctance to accept a loss, can
be deadly. For example, one of your investments may be down 20% for good
reason. The best decision may be to just book the loss and move on.
However, you can’t help but think that the stock might comeback.
This latter thinking is dangerous because
it often results in you increasing your position in the money losing
investment. This behavior is similar to the gambler who makes a series of
larger bets in hopes of breaking even.
Source: CFA Institute
Your
brain remembers everything.
How you trade in the future is often
affected by the outcomes of your previous trades. For example, you may
have sold a stock at a 20% gain, only to watch the stock continue to rise after
your sale. And you think to yourself, “If only I had waited.” Or
perhaps one of your investments fall in value, and you dwell on the time when
you could’ve sold it while in the money. These all lead to unpleasant
feelings of regret.
Regret minimization occurs when you avoid investing
altogether or invests conservatively because you don’t want to feel that
regret.
Source: CFA Institute
Your
brain likes to go with the trends.
RBC Capital Markets
Your ability to tolerate risk should be
determined by your personal financial circumstances, your investment time
horizon, and the size of an investment in the context of your portfolio. Frame
dependence is a concept that refers to the tendency to change risk
tolerance based on the direction of the market. For example, your
willingness to tolerate risk may fall when markets are falling.
Alternatively, your risk tolerance may rise when markets are rising.
This often causes the investor to buy
high and sell low.
Source: CFA Institute
Your
brain is great at coming up with excuses.
Sometimes your investments might go sour.
Of course, it’s not your fault, right? Defense mechanisms in the form of
excuses are related to overconfidence. Here are some common excuses:
- ‘if-only’: If only that one thing hadn’t happened, then I would’ve been right. Unfortunately, you can’t prove the counter-factual.
- ‘almost right’: But sometimes, being close isn’t good enough.
- ‘it hasn’t happened yet’: Unfortunately, “markets can remain irrational longer than you and I can remain solvent.”
- ‘single predictor’: Just because you were wrong about one thing doesn’t mean you’re going to be wrong about everything else, right?
- ‘dog ate my research’**
Source:
CFA Institute
14 October 2012
DOW, big rally?

the dow suggests a strong rally, why? because the dow breaks out of the purple neckline for quite some months already.
since this is a monthly chart, expect quite some bumps ahead, the nearest one is the rising wedge which might pull the dow down significantly so it does not look like a breakout above the neckline, then all of a sudden, it rallies up to caught everyone with big surprises.
how will hsi behave? well, that is for the next update.
09 October 2012
Dow reached new high short term, but investors do not agree
the stock market volume shrinks not only in hk, but in the states as well. this has big impact on ipo market
why has this happened? read an article from wsj.
The stock market is reaching toward new highs on the fourth anniversary of the financial crisis, but many people refuse to be lured back.
Even as stock indexes have doubled in value since the market low in March 2009, investors have yanked a net $138 billion from mutual funds and exchange-traded funds that invest in U.S. stocks, according to the Investment Company Institute, a mutual-fund trade group. Investors over the same period put $1 trillion into bond funds, a traditionally lower yielding but safer investment.
It marks the first time since 1981 that investors have pulled money from U.S.-stock funds for more than a year at a time.
Crumbling confidence in stocks reflects a broader loss of trust in the stock market and in the idea that the prudent investor could expect a comfortable retirement and even a measure of wealth.
The stock market has become the foundation of U.S. retirement savings, with nearly half of American families owning stocks. But wounded investors, worried about another big loss, are triggering a decline in stock ownership.
Market busts in the 1930s and 1970s soured previous generations of investors. Now, said money manager Steven Leuthold, of the Leuthold Group in Minneapolis, "I think we've lost another generation."
The signs of disaffection are widespread. The percentage of American families who say they own stocks or stock funds slumped to 46% in 2011 from 53% in 2001, according to the Investment Company Institute. Only a quarter of households with retirement plans were willing to take above-average investment risk in 2011, down from 33% in 1998, an ICI survey found.
Mutual funds, predominantly owned by individuals, widely reflect the investment patterns of ordinary people. Whether they made profits or losses after exiting the funds depends on when they bought. Regardless, it is now a cliché that small investors are less interested in the return on their money than in the return of their money.
Rosa White, a 27-year-old TV-commercial producer in Brooklyn, sold about half of her stock portfolio this spring and moved the cash to a money-market account. She is still buying stock funds through her 401(k) retirement account, she said, but plans to reduce those contributions. She would like to invest more aggressively but said she was afraid.
"Every other day on the news there's some crisis," she said. "The whole euro-zone collapse talk keeps going and going. If it's not Greece, it's Spain. Then there's the whole Facebook blowup."
Although most people don't like to tinker with their retirement accounts, the portion allocated to stocks in 401(k)-type accounts overall fell to 61% in July from 70% in early 2007, based on data from Aon Hewitt, a firm that manages corporate benefit plans.
The stock allocation would be even lower except that many companies are automatically putting new employees in so-called target date plans, which direct most of their contributions to stock funds, said Patti Bjork, Hewitt's retirement research director.
"The fear in the mind and heart of the investor is more acute now than it was in the '70s, because the investor class today doesn't know what to do, doesn't see an option," said David Kotok, president of Cumberland Advisors, which manages about $2 billion in Sarasota, Fla.
Many investors are afraid of the real-estate market and are unhappy with bonds. "People don't want to be in cash at a zero interest rate and have a growing fear of longer-term bonds because the yield is so low and the price risk is now high," Mr. Kotok said.
Demand for bonds, together with central bank policies aimed at stimulating the economy, has pushed interest rates and bond prices to extremes. Prices and yields will eventually return to more normal territory, and people invested in bond funds could see future declines.
Still, Mr. Kotok said, clients call him asking to get out of stocks. "The conversation will go something like this: 'The market is up enough, I don't like the way things are, take me out and put me in bonds.' I get that every few months. I rarely get a call telling me to go the other way," Mr. Kotok said.
Some clients say they no longer trust Wall Street. "I get the reaction, they are a pack of thieves and liars and you can't trust them," he said. "The news flow continues to reinforce it."
A parade of Wall Street scandals has given small investors the impression they are at a disadvantage, beginning a decade ago with criminal behavior at Enron and WorldCom. More recently, bankers at Barclays PLC admitted to trying to manipulate for years an interest rate widely used as the basis for U.S. mortgage rates; J.P. Morgan Chase & Co. disclosed a trading goof that has cost the bank at least $5.8 billion; and Morgan Stanley and the Nasdaq Stock Market have been criticized for their handling of Facebook's stock offering, which cost investors billions.
"I've changed my views remarkably on how to invest in the market," said Franklin Riesenburger, 66-year-old lawyer in Cherry Hill, N.J.
Through the 1990s, Mr. Riesenburger was a dedicated buy-and-hold stock investor, owning no bonds and delighting at the risks of the stock market. He made good profits in small technology and biotech stocks. But after technology stocks collapsed in 2000, he decided the world had changed.
"On July 18 of that year I started my new wave of investing," he said. "I sold everything."
Today, Mr. Riesenburger considers the stock market a scary place. Over the past year, he gingerly put money back into such blue-chip stocks as AT&T, Coca-Cola and Exxon Mobil. He sold those stocks as global economic growth slowed this summer.
In late September, he returned about a third of the money to blue-chip stocks and a gold fund, betting that Federal Reserve stimulus would push those investments higher. Depending on events, he said, he will either increase that bet or pull out his money.
Most of his savings remains in bonds, real estate and money-market funds. "I do not trust the stock market to put in lasting gains," said Mr. Riesenburger. His main concern now, he said, is avoiding a loss.
As in the 1930s and 1970s, when stock price collapses and financial scandal mangled savings, it could take years to rebuild confidence, Mr. Leuthold and other money managers said.
After the 1929 crash, the Dow Jones Industrial Average didn't return to its previous high until the 1950s. After the stock market turmoil that began in 1966, the Dow didn't start recording sustained gains until the 1980s.
Beginning in 1971, investors withdrew money from stock funds for 11 consecutive years as the U.S. struggled with oil crises and stagflation, the pernicious combination of inflation, high unemployment and little growth.
Mutual-fund firms are seeing another exit today. Demand for U.S.-stock funds peaked in 2000, after technology stocks collapsed and the market began a 2½ year decline.
Some optimism returned in 2003, but flows into U.S. stock funds never reached 2000 levels.
People began taking substantial money out of U.S.-stock funds in 2008, the year Lehman Brothers Holdings declared bankruptcy, big banks sought a government rescue and the global economy teetered on a precipice.
The decade's two financial calamities cost the stock market many long-term, stable investors who helped support the double-digit annual stock gains that created vast wealth in the 1990s.
Jay Greenblatt, a 75-year-old lawyer, said for years he had no stocks and held most of his money in tax-free municipal bonds. About 20 years ago, he said, he hired an investment adviser, who persuaded him to diversify into stocks.
Mr. Greenblatt did well, and he kept as much as a quarter of his money there until 2007, when he decided to exit. His investment adviser persuaded him to keep about 10% in stocks.
"I ski the biggest mountains all over the world. I have ridden my motorcycle all over the country. I love risk, but I still fear the market," Mr. Greenblatt said.
"There is just no stability in the world on anything," he said. "It is the fact that the entire nation, if not the world, is living on credit. It is the fact that the values of stocks have no real relation in my book to the earnings of corporations but rather in a popular sense are speculative and based upon puffing, PR, a presumed future growth."
Two weeks ago, worried about the U.S. election's impact on the stock market, Mr. Greenblatt sold his remaining stocks and put the money in bonds.
The flight from stocks could be worse. Retirement accounts still funnel billions of dollars into U.S.-stock mutual funds each year. In the 1970s and 1930s, 401(k) plans didn't exist, so the stock exit was more stark.
In addition, figures on exchange-traded funds probably overstate demand for stock funds among rank-and-file investors because they also are used by professional traders for hedging.
A pullback from stocks leaves trading increasingly in the hands of professionals—hedge funds and high-frequency traders that use hard-to-regulate computerized methods. That makes the market more volatile, helping fuel such events as the "flash crash" on May 6, 2010, when the Dow Jones Industrial Average fell 700 points in eight minutes.
A decade ago, high-speed trading made up a small share of stock trading. Today, many large companies do little else, holding shares for as little as a second. They now represent more than half of all stock trades, according to Tabb Group, which tracks such transactions.
The trend away from the stock market has been reinforced by aging baby boomers, the oldest now well into their 60s. People nearing retirement often pull back from stocks to preserve their gains. Others who lost jobs in the downturn sold stocks to pay bills.
Some people shifted money into international-stock funds, banking on China and other fast-growing economies. But many have sold those mutual funds in recent weeks.
Mr. Leuthold said he saw the Great Depression's stock market hangover extend into the 1960s. "When I started as a broker in '61, we had a couple old guys in the office who had suffered through the Depression, and two of them, personally, would not own a share of stock," he recalled. "One said, 'I would only invest in real estate.' "
William Hackney, a partner at Atlanta Capital Management in Atlanta, Ga., recalled when investors abandoned stocks in the 1970s. Eventually, the U.S. economy and the stock market recovered, he said: "My point is, this, too, will pass."
But first, painful memories will have to fade.
"People are scared stiff to go through an '08 again," said Mark Pollard, a financial adviser in Princeton, N.J., with Merrill Lynch Wealth Management. "People do talk about that: 'Whatever you do, I don't want to go through an '08 again.' "
Joe Light contributed
to this article.
10 September 2012
Double QE, rosy short term outlook but gloomier long term
my forecast last time is that QE likely coming sooner and it did from QE of ECB. QE from the us will not be far behind if you look at gold price and the euro/usd exch rate. the usa could not afford to let euro fall too much, so QE must come. how effective will QE from the fed be, we will talk about this later.
the island top formation is now distorted. like i said earlier i have never seen an island top of that size this turns out to be a booby trap.
QE from the fed has shown to be less and less effective, but it has disastrous results on the emerging economies esp china, this is why you see the shanghai composite index is way down after various rounds of QE. do go back in this blog on a topic stock indexes, the conclusions drawn are still valid.
new research from many economists has shown that debt has grown so much that QE may no longer be effective as the percentage of money created by QE vs the money supply is growing smaller and smaller each time.
politicians have now relied too much on the fed to do their jobs and do not have the political will to rein in spending or they are afraid to see society getting into an anarchy ie they no longer can command law and order. even developed economies may begin the disintegration into Libya or Egypt state.
because so much is diverted to the state that private sector cannot get the credit needed to grow and consumers cannot get mortgage or other loans unless you are a AAA rated consumer.
all these will eventually show up in the profits of public companies and thus the stock market.
with oil prices hovering around 115 or even higher in due course, europe will only go deeper into recession.
in the next few years, the baby boom generation will get into retirement in large droves, so if governments do not do the right things soon, eventually we might be having much higher inflation, the inflation these two years will look rather mild.
03 September 2012
HSI, GOLD, QE coming sooner?


HSI
this is a chart waiting for a top to be confirmed [not formed] as the island top has been formed, so therefore the next day or two is important that it will not fill the gap on the right, otherwise the formation is distorted,
rsi indicates there is room to fall if the island top is confirmed.
i have never seen such formation in the course of my investment life, usually an island is only composed of a day or two either at the top or bottom, never an island of 10 or more days. maybe govt is interfering too much so everything is distorted.
usually after an island top or bottom is confirmed expect a one way blowout or fallout of at least 2000 points.
GOLD
the recent shoot up in gold is likely a short covering or QE coming sooner? ECB officials did not show up at Jackson Hole, any hints!!!
the gold chart indicates it will hit 1730, if there is less than 50 to gain, just wait a while. also follow it closely if you have taken position since the top may not last too long for you to close out the position.
rsi indicates it will top out pretty soon, would then the fall coincides with the hsi fall as well?
02 September 2012
QE and possible Consequences
an OECD economist has written a paper available as below:
http://dallasfed.org/assets/documents/institute/wpapers/2012/0126.pdf
this paper should be read by the young and old as it looks likely to affect many generations.
this paper might help you plan your investments for retirement or check the pension plan out offer by your employer, government to see whether they are adequate.
the paper looks technical but in fact it is not quite, an ordinary economics student can read through with ease. the trouble is do you have the patience since there are 37 pages to read, yet each page is quite short.
for those of you who like to jump to conclusion can read page 36-37, then read through the rest when you have more time.
28 August 2012
Apple vs Samsung
Here is an article from wsj that at least someone from the states is telling the truth.
Apple's Lawsuit Sent a Message to Google
Last week Apple made headlines twice. On Monday it broke the world record for shareholder value. Apple's $623.5 billion market cap beat Microsoft's record from tech's notorious bubble era. (Microsoft needed a price-to-earnings ratio of 72 in 1999 to set the record. Apple's ratio is a modest 16.) Then on Friday, Apple won a $1.05 billion patent-infringement judgment against Samsung, the Korean electronics giant and the maker of the Galaxy line of smartphones that stirred Apple's ire.
One, how badly has Apple been hurt by copycats if it has become the richest company on earth? Do we want a patent system in which the strongest sue everyone else? Is this good for innovation?
Two, Apple lost the jury trial, in a federal court in San Jose, Calif., on most of its hardware claims, such as a ridiculous patent on curved glass for phone surface design. Apple won mostly on software, such as "pinch and stretch," a nifty design trick Apple introduced in 2007 with its first iPhone. So why did Apple sue Samsung, the Galaxy hardware manufacturer, and not Google, maker of the phone's Android software?
Apple sees Google as its chief competitor—this is no secret. Steve Jobs so hated Google's Android that, even as he struggled with cancer, he told biographer Walter Isaacson: "Google . . . ripped off the iPhone, wholesale ripped us off. I will spend my last dying breath if I need to, and I will spend every penny of Apple's $40 billion in the bank, to right this wrong. I'm going to destroy Android, because it's a stolen product. . . . I'm willing to go thermonuclear on this."
It is revealing that Jobs spent precious energy in such an outburst. As a longtime Silicon Valley observer, I believe the real story is not what it seems. The source of Jobsian rage was not his Google loathing, per se. It was fear that Apple might be "Microsofted" again.
Some history: As many people know by now, Apple founder Steve Jobs and Macintosh computer designer Bill Atkinson drew heavily from the work of Xerox's Palo Alto Research Center. In the 1970s, PARC had developed a computer called Alto. The computer featured all kinds of new stuff, including a mouse and pop-up windows. Jobs visited PARC in 1979 and a light switched on. A day or two later, Jobs met with an industrial designer and ordered him to build a prototype computer with a mouse. Thus was born the Apple Macintosh, which made its debut in 1984.
Did Apple steal from Xerox PARC or not? In the broadest sense, yes. The visit to PARC did more than inspire Steve Jobs. It sent him directly on a mission to build something very much like the Alto. But Jobs being Jobs, he immediately had ideas for improvement. The mouse should have one button, not three. It should work on any surface. It should be cheap to manufacture. The pop-up windows should look this way, not that way.
Jobs swiped the idea and made it better. But Macintosh was only modestly successful in the market, and Jobs was asked to leave Apple in 1985.
Meanwhile, his baby-boomer rival, Bill Gates, had introduced Microsoft Windows software in 1983. It wasn't pretty, and it didn't work well until version three in 1986, two years after the Macintosh's arrival. But it incorporated several Apple features, and the personal-computer industry built around Windows software soon boomed and grew to immense size. Microsoft PCs crushed the Macintosh market share, which fell to 3% by the late 1990s.
In the mind of Steve Jobs, I believe, the story was this: Even if he did copy the idea of the Xerox Alto, he added so much value that the copying barely amounted to technological petty larceny; Microsoft, by contrast, just ripped off Apple without improving it.
What Bill Gates improved, of course, was not Apple's software but the entire business model for personal computing. That's how Microsoft came to dominate personal computing for a generation. That's how Microsoft beat the market-cap world record and held it until Apple topped it nearly 13 years later.
Jobs deeply feared a replay of this business-model history. He feared that Google was going to pull a Microsoft and once again reduce Apple's products to a pricey niche. To Jobs, Android looked like the new Windows.
So why doesn't Apple sue Google directly, instead of suing a Google hardware partner like Samsung? Politics and public relations, mainly. Apple knows that suing a foreign giant will go down a lot better than suing a Silicon Valley neighbor. Apple enjoys huge favor right now among customers, politicians and the public. Suing Google would divide Apple's support and tarnish the company's image. So Apple sued a foreign company to send a message to Google.
This techno-Shakespearian story is entertaining but is bad for the phone-buying public. (Tablet patents were also part of the Apple-Samsung court case, but smartphones were at the heart of the lawsuit.) As Samsung contemplates filing an appeal, it appears that smartphone-makers may begin redesigning their products to avoid crossing swords with Apple.
Last week I bought a Samsung Galaxy Note phone. It is a marvel of machinery. It is larger, slimmer and lighter than Apple's iPhone. The Samsung Note's screen is so large that people who see it think I must have acquired an early version of the mini-iPad that Apple is expected to release soon. The Note takes the iPhone hardware design and makes it significantly better.
Mr. Karlgaard is the publisher of Forbes.
23 August 2012
Dow breakthrough
Do you believe insider trading can be prevented?
The Fed emphasizes their meeting minutes be kept confidential till about 3 weeks before they are released.
The Fed meetings website is below:
http://www.federalreserve.gov/monetarypolicy/fomccalendars.htm
The recent meeting 31July/1Aug minutes released yesterday should indicate QE3 coming pretty soon and if they are kept really confidential with no insider trading then the Dow should have a sudden break upside yesterday, but it didnt.
Why? Check below.
The recent low is 12778 on 2Aug , the recent high is 13330 [21Aug], smart readers should be able to draw conclusion from here and position themselves accordingly.
The Dow details [source Yahoo, rounded] are listed below:
| Date | Open | High | Low | Close | Volume | |||
| 21-Aug-12 | 13,272 | 13,331 | 13,187 | 13,204 | 1,170,600 | |||
| 20-Aug-12 | 13,275 | 13,276 | 13,230 | 13,272 | 875,900 | |||
| 17-Aug-12 | 13,251 | 13,281 | 13,245 | 13,275 | 1,385,500 | |||
| 16-Aug-12 | 13,163 | 13,269 | 13,146 | 13,250 | 1,145,800 | |||
| 15-Aug-12 | 13,157 | 13,193 | 13,138 | 13,165 | 771,300 | |||
| 14-Aug-12 | 13,168 | 13,223 | 13,142 | 13,172 | 844,300 | |||
| 13-Aug-12 | 13,205 | 13,205 | 13,113 | 13,169 | 675,500 | |||
| 10-Aug-12 | 13,163 | 13,208 | 13,095 | 13,208 | 866,400 | |||
| 09-Aug-12 | 13,175 | 13,200 | 13,125 | 13,165 | 843,500 | |||
| 08-Aug-12 | 13,158 | 13,203 | 13,115 | 13,176 | 849,100 | |||
| 07-Aug-12 | 13,119 | 13,216 | 13,118 | 13,169 | 952,400 | |||
| 06-Aug-12 | 13,100 | 13,187 | 13,100 | 13,118 | 842,700 | |||
| 03-Aug-12 | 12,885 | 13,133 | 12,885 | 13,096 | 1,123,900 | |||
| 02-Aug-12 | 12,970 | 12,970 | 12,779 | 12,879 | 1,127,700 |
21 August 2012
You Bought. They Sold
One reason why ordinary amateur investors keep on losing money in the stock market is depicted in detail by the article below.
But you can also piggy back on their tails by spending more time on charts which give you an idea where the smart money is heading. You wont outsmart them, yet you can still get some decent returns.
For those of you who want to know the power of charts should read the earlier part of this blog esp sections on HSBC.
You Bought. They Sold.
All over corporate America, top execs were cashing in stock even as their companies were tanking. Who was left holding the bag? You.
By Mark Gimein Reporter Associates Eric Dash, Lisa Munoz, Jessica Sung
September 2, 2002
(FORTUNE Magazine) – Over the past months, the public has been treated to an ever-lengthening parade of corporate villains, each seemingly more rapacious than the last. First there were the Enronites, led by the now disgraced Kenneth Lay, Fifth-Amendmenting their way through the halls of Congress. Then there was Global Crossing's Gary Winnick, with his Drexel Burnham resume and hundreds of miles of useless undersea cables. And of course there was Tyco CEO Dennis Kozlowski, who, despite having made hundreds of millions of dollars from Tyco stock options, stands accused by the government of shipping empty boxes out of New York to avoid the sales tax--the sales tax!--on his million-dollar paintings.
These people and a handful of others are the poster children for the "infectious greed" that Fed chairman Alan Greenspan described recently to Congress. But by now, with the feverish flush of the new economy recognizable as a symptom not of a passion but of an illness, it has also become clear that the mores and practices that characterize this greed suffused the business world far beyond Enron and Tyco, Adelphia and WorldCom.
With assistance from Thomson Financial and the University of Chicago's Center for Research in Securities Pricing, FORTUNE set out to answer an obvious question: As Lay, Winnick, Kozlowski, et al. were dumping their shares and getting rich, what were the rest of America's top executives doing? Gary Winnick, we all now know, sold some $735 million in stock as his company was hurtling toward bankruptcy. But was this really the ultimate in millennial avarice?
In a word: no.
The not-so-secret dirty secret of the crash is that even as investors were losing 70%, 90%, even in some cases all of their holdings, top officials of many of the companies that have crashed the hardest were getting immensely, extraordinarily, obscenely wealthy. They got rich because they were able to take advantage of the bubble to cash in hundreds of millions of dollars' worth of stock--stock that was usually handed to them via risk-free options--at vastly inflated prices. When the bubble burst, their shareholders were left holding the bag. But, hey, they had theirs.
How much did they take in? We'll get to that in a second, but first we need to explain the criteria for the list that accompanies this story. First, we looked at companies that had hit a market cap of at least $400 million--and fallen by at least 75% from the highs they reached during the bubble years. Second, we counted insider stock sales from 1999 onward. (That's why Gary Winnick's tally comes to "only" $508 million on our list; he had sold a ton of Global Crossing stock before 1999.) And third, we included only stock sold by top executives and board members; the quick profits made by the venture capital firms that funded the dot-com boom were excluded. (Also excluded in all but a very few cases--largely because it's impossible to track--was stock sold by company officers after they left their jobs. For the same reason, we did not include the cost of acquiring the shares; in most cases option prices were so low that including that cost would hardly affect the totals.) What we cared about, ultimately, was a simple, straightforward thing: How much cash did the top executives at America's Losingest Companies reap by selling their shares to the investing public?
Even with these fairly narrow parameters, the numbers are astounding. Executives and directors of the 1,035 corporations that met our criteria took out, by our estimate, roughly $66 billion. Of that amount, a total haul of $23 billion went to 466 insiders at the 25 corporations where the executives cashed out the most. Those are the companies that make up this list.
The top 25 include some big and obvious names: Cisco (CEO John Chambers: $239 million), for instance, and AOL Time Warner, parent of FORTUNE's publisher (chairman Steve Case: $475 million). But they also include companies you would be surprised to find on a top-25 list of any kind. Executives and directors at a software maker called Ariba raked in $1.24 billion even as its stock was falling from $150 to around $3. Yahoo executives reaped $901 million in stock sales while the company's shares fell from $250 to about $11. InfoSpace, once touted by its founder, Naveen Jain, as on its way to becoming the first "trillion-dollar" company, makes the list. In early 2000, by which time Jain had already taken out more than $200 million, he protested to FORTUNE that "investors...know I am committed to our long-term success." Now Jain's "trillion-dollar" company has a stock price of around 50 cents and a market cap around $145 million--and meanwhile, its founder has sold an additional $200 million or so. i2 Technologies, which makes supply-chain management software, now has a total market cap that is less than CEO Sanjiv Sidhu's haul of $447 million. Peregrine Systems is a deeply troubled software company that is on its third auditor in six months, has announced that it will restate years of revenues, and faces delisting from Nasdaq. Its stock is below 40 cents. But not to worry. Back before anyone realized that its revenues were misstated, chairman John Moores cashed out $646 million, enough to cover the losses of the San Diego Padres, which he also owns, for the next 85 years.
For the record, the company that tops our list is Qwest Communications, the beleaguered telecom. Company executives took down a staggering $2.26 billion, with then-chairman Phil Anschutz alone selling almost $1.6 billion of stock to BellSouth in May 1999. The price he got, $47.25, was nearly $8 a share above Qwest's market price at the time. Qwest now trades at a little more than $1 a share. Of course, Qwest has also announced that it had inflated its revenues over the past three years.
For an ordinary investor, it is nearly impossible to look at this list and not feel ripped off. In some cases insiders clearly cheated the investment community to realize their gains--by ginning up revenue numbers that have turned out to be phony. But even putting those cases aside, the billions of dollars of insider sales make absurd many of the rationales executives used to justify their new wealth. Take, for instance, the notion that executives were being rewarded for performance. Plainly, the executives on this list did not perform. They failed miserably; in many cases they failed even as they were bragging about how well they were doing and how much their stock would rise.
As for the idea that big stock and options grants would align the interests of shareholders and managers--that now seems equally absurd. What really took place was a breach of faith, with the insiders in effect betraying their shareholders by making sure that they themselves wound up rich no matter how badly things turned out for their companies or their investors.
Not surprisingly, most of the money was taken down at the height of the bubble, during the era of Dow 36,000 and day-trading mania, as a grand speculative fervor swept the country. For too many executives, the easy riches to be made were hugely tempting, and the moral (and sometimes legal) niceties easily ignored. All too often, the people who ran the companies that were the darlings of the bull market saw nothing wrong with taking a seat at the casino, selling high, and cashing out their chips. To put it another way, they got greedy.
To be sure, that wasn't true of everybody. If you look closely at the accompanying list, there are some names you will not find. David Filo, one of the two founders of Yahoo, is not there. Even as Yahoo's top executives sold hundreds of millions of dollars of stock, Filo himself sold nothing. You will also not find Gerald Levin, the former chief executive of AOL Time Warner. Say what you will about the wisdom (or lack thereof) of the AOL Time Warner merger, you can't say that Levin saw it as a shortcut to personal enrichment. He, too, didn't cash in.
It's tempting for some to see a cultural divide between executives of the old economy and the new. But really it's a moral divide between the CEOs and the CEO speculators. "By and large for the people doing it [selling their shares], the financial component of being in those companies outweighed the executive responsibility," says Michael Ramsay, CEO of Tivo, who sold less than $1.6 million of stock.
One of the most cogent explanations of what's wrong with this practice comes, amazingly, from Henry Nicholas, chief executive of Broadcom (No. 2 on the list) and a man who has taken out $799 million even as Broadcom's stock went from a high of $274 a share to around $22. In an interview, Nicholas said that he told his employees, "If you sold your shares to somebody at the top of the market, somebody has bought shares from you. Imagine it's your mother or grandmother--now she's lost half her money." Thinking about whom you're selling to isn't something the market should demand of ordinary shareholders--but isn't it worth considering for a CEO whose job, ultimately, is to make sure his shareholders do well?
Not surprisingly, most of the executives on our list declined to discuss their stock sales. Those who did often professed to be simply oblivious to the issue. "We really provided tremendous value," insisted Keith Krach, chairman of Ariba. His total take: $239 million--with his first sale coming a mere 122 days after Ariba's IPO and two days after the expiration of his unusually short four-month post-IPO lockup.
Says JDS Uniphase CEO Jozef Straus, who sold $147 million in shares within three months of taking the CEO spot in May 2000: "It was done in the middle of the growth market. Everybody was saying that it was going to be moving up for the next five years." Besides, he adds tellingly, "Why would I not sell? I was a shareholder like any other shareholder." Here's InfoSpace founder Naveen Jain: "Nobody believed [InfoSpace's stock] was overpriced. If I did, I would have been selling a lot more." Jain is a particularly egregious case; he actually got his company's underwriters to let him sell shares in a secondary offering before the IPO lockup period had ended.
And what of Henry Nicholas of Broadcom, who sold and sold and sold at prices as high as $260 a share as the bull market ran its course? "I would sit and talk to people [during the boom], and I would ask, 'How do we rationalize any of these valuations?'" he says. "There seemed to be a disconnect. I was sitting there going, 'Wow! Look at these valuations.' But I was also sitting there thinking, Maybe this is a new economy."
"I didn't go to business school," Nicholas adds--implying that he didn't have the market sophistication to understand that we were in a bubble. Now, of course, the investors who bought their shares from him ("Imagine it's your mother or grandmother") have lost well over half their money. But after telling us that he was in no position to know what value was "right" for his stock, he conceded that he had dramatically cut back his selling in 2002. Why? Because the price was "just too low."
It's important to note some caveats. Gateway founder Ted Waitt left Gateway for about a year--and stopped selling shares when he returned to take over the by-then-troubled computer maker. Indeed, he has recently been a buyer of Gateway stock. Others, including Case and Jain, have also bought back shares. Mind you, they've bought in much smaller amounts--and at much lower prices--than they sold: Case announced he was buying $24 million in AOL Time Warner stock, while Jain purchased InfoSpace stock when it got to $4 a share. "Sell high, buy low" doesn't exactly add up to a manifesto of corporate responsibility.
Several others, such as John Malone and Jim Barksdale, wound up on the list because they took board seats at AT&T and AOL, respectively, when their companies were bought. And then there's Jay Walker, who vehemently protested his inclusion on this list. Walker pointed out that he had plowed most of his net worth--$36 million--into starting up Priceline; that he had bought $125 million worth of Priceline stock in November 1999 at a price far above the IPO price; that he had personally lost $264 million in "two privately held startups that were built on my faith in the name-your-own-price concept"--and that he had never "dumped" his shares on small investors. Instead he had sold directly to sophisticated buyers, including Microsoft co-founder Paul Allen and Saudi Prince Alwaleed. "I believe," he wrote, "that this differentiates my activities from those of other entrepreneurs and corporate executives who clearly, in hindsight, were simply trying to take the money and run." Point taken.
Still, most of the people on this list did take the money and run--and even now they don't seem to feel too bad about it. Maybe just a little embarrassed. When FORTUNE asked an Ariba spokeswoman whether former CFO Edward Kinsey still had his estate next door to Larry Ellison in Atherton, Calif., the spokeswoman quickly corrected us. The house was "across the street, not next door." And anyway, she explained, Atherton--where Kinsey paid $22 million for an estate--is "really modest."
Perhaps the most honest response came from an officer of a company that just barely missed making our list. "I didn't need the money then, and I don't need the money now," he told FORTUNE. But, he added, "if I'd known there was going to be a witch hunt like this, I'd never have done it."
Look, nobody's saying that founders or CEOs shouldn't have been able to take a little money off the table. But this wasn't a "little" money--$66 billion is a huge sum, and the anger it has generated seems, quite frankly, justified. "It all comes down to your personal set of rules about what being an executive of a company really means," says Tivo's Michael Ramsay. Pace Jozef Straus, executives aren't "just shareholders like any other shareholders." Not even close.
REPORTER ASSOCIATES Eric Dash, Lisa Munoz, Jessica Sung
Subscribe to:
Posts (Atom)

